
Australia produces just under 1% of global electricity ranking 20th in terms of national generation. China and the US are responsible for almost half of global generation so Australia is 2% of non superpower generation. As a small but meaningful producer, what are the similarities and differences Australia shares with similar sized national grids? How do decarbonisation challenges compare in both scope and complexity among these nations?
Countries with a comparable power demand to Australia
The dozen nations with total generation similar to Australia are listed in Table below (1) – it is an interesting mix of OECD and non-OECD economies using a range of different generation technologies.
Table 1 Electricity Generation mix for nations with a similar total power requirement to Australia
| Wind / Solar | Geothermal | Hydro | Nuclear | Fossil Fuels | Biomass & Waste | Pumped Hydro | |
| Spain | 30.2% | 0.0% | 13.1% | 22.0% | 32.5% | 2.6% | -0.5% |
| United Kingdom | 29.5% | 0.0% | 2.6% | 15.2% | 37.8% | 15.0% | -0.2% |
| Sweden | 17.8% | 0.0% | 44.7% | 29.5% | 1.0% | 6.9% | 0.0% |
| Australia | 17.0% | 0.0% | 6.2% | 0.0% | 75.4% | 1.4% | -0.1% |
| Italy | 16.1% | 2.4% | 17.6% | 0.0% | 56.0% | 8.2% | -0.2% |
| Turkey | 12.2% | 3.7% | 26.3% | 0.0% | 56.2% | 1.5% | 0.0% |
| Norway | 6.5% | 0.0% | 92.2% | 0.0% | 1.2% | 0.3% | -0.1% |
| Thailand | 4.5% | 0.0% | 2.6% | 0.0% | 83.3% | 9.6% | 0.0% |
| South Africa | 4.3% | 0.0% | 2.5% | 5.2% | 88.5% | 0.2% | -0.7% |
| Egypt | 3.5% | 0.0% | 7.7% | 0.0% | 88.7% | 0.2% | 0.0% |
| Taiwan | 3.1% | 0.0% | 2.2% | 11.3% | 82.5% | 1.3% | -0.4% |
| Vietnam | 2.7% | 0.0% | 25.2% | 0.0% | 70.7% | 1.4% | 0.0% |
| Indonesia | 0.2% | 5.7% | 6.8% | 0.0% | 82.3% | 5.0% | 0.0% |
Wind and Solar Resources – current and potential
Australia is ranked fourth for current wind and solar generation – behind Spain, the UK and Sweden. Of these, Spain is perhaps the most suited to widespread onshore wind and solar, while the UK and Sweden have excellent offshore wind resources.
In terms of potential generation, Australia has a vastly greater land mass than any of the other of the nations – in fact it would have a land area greater than all of the others combined. Together with a modest population Australia has a massive advantage in terms of wind and solar potential.
From a solar generation perspective, Australia not only has an enormous area it could conceivably allocate to solar power but it also has some of the highest natural solar power density as shown in Figure below (2). In other words Australia is a vast country where the sun shines more consistently than almost anywhere else.
Figure 2 Global comparison of Solar Power Density

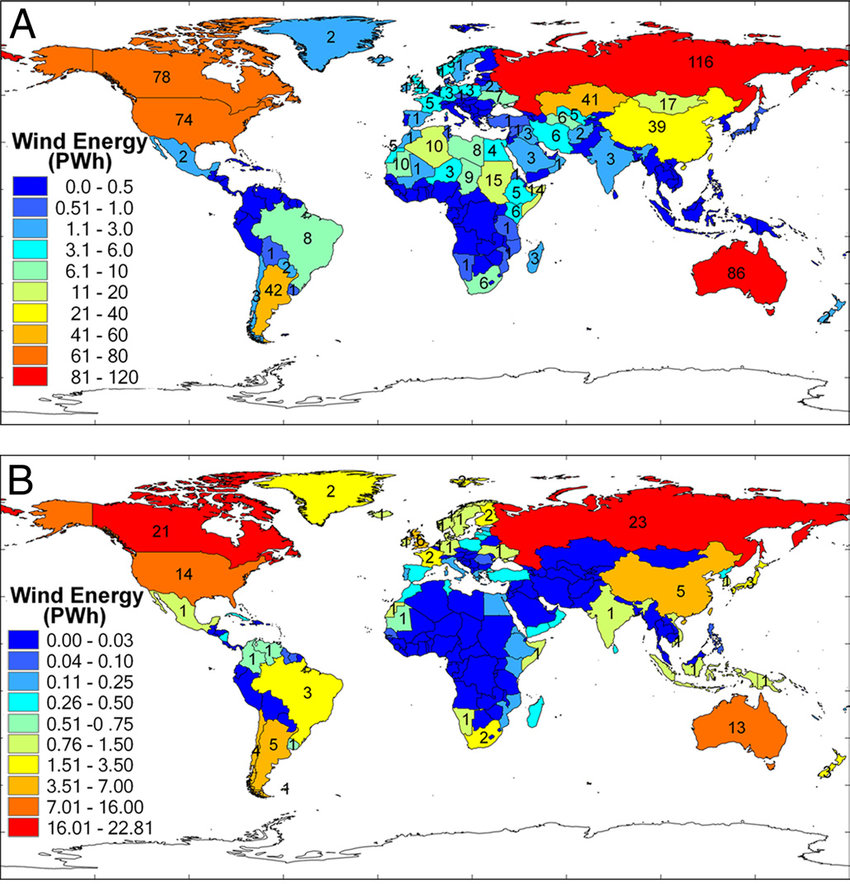
The same applies for wind generation as shown in Figure 3A and 3B below (3). Figure 3A shows onshore potential wind generation in PWh (1 PWh = 1000 TWh) based on the utilisation of all areas with a capacity factor greater than 20% (excluding forested, urban or aquatic lands). The capacity factor is the estimated actual generation as a fraction of the maximum output – in crude terms a measure of what proportion of the wind a location is windy enough to support generation. Figure 3B is based on a similar analysis for offshore wind generation for the area within 93 km of the coastline. By both measures Australia has significantly more theoretical wind and solar generating capacity than its mid-sized peers and only nations with a similarly large land area (the United States, Russia and Canada) are in the same ballpark.
Figure 3 Global wind generating potential A = Onshore B = Offshore
Australia’s excellent wind and solar resources have prompted some commentators to suggest it could ( or perhaps should) become a green energy exporting “superpower”, with excess wind and solar – excess to that needed to satisfy domestic demand – being used to generate green hydrogen or ammonia.
Obviously there are plenty of hurdles to overcome in turning theoretical wind and solar generation into actual electricity output. One major hurdle is obviously the intermittent and seasonal nature of wind and solar generation. Domestic supply will require batteries and other storage systems, while a large-scale hydrogen or ammonia export operation could be designed to cycle up and down as power availability fluctuates and with significant final product storage to enable consistent shipment rates. Another key hurdle will be managing competing demands on what is the best end use for a country’s available land. In Australia, indigneneous groups will have a major input into land use decisions to which will be added potentially competing claims from farmers, conservationists, recreational users and mining companies. That said Australia is in a better position than many other nations to make the transition to zero carbon electricity.
Wind and Solar vs other generation
Another relevant metric in assessing relative decarbonisation complexity is the likely final proportion of wind and solar when each nation has fully decarbonised its grid. This is estimated in Table 2 assuming that hydro and nuclear levels in Table 1 are maintained and ignoring any requirement for increased demand
Table 2 – Estimated final proportion of Wind and Solar in the national generation mix
| Spain | 62.7% | Thailand | 87.8% | |
| United Kingdom | 67.3% | South Africa | 92.8% | |
| Sweden | 18.8% | Egypt | 92.2% | |
| Australia | 92.4% | Taiwan | 85.6% | |
| Italy | 72.1% | Vietnam | 73.4% | |
| Turkey | 68.4% | Indonesia | 82.5% | |
| Norway | 7.7% |
This shows that Australia will require a final generation mix made up of something like 92% wind and solar supported by 6% hydro and 2% biomass. This is similar to five other nations listed in Table 1 that will potentially need to get over 80% of their decarbonised generation from wind and solar. The other seven nations in the comparator group have sizable nuclear and/or hydro assets which will reduce the need for wind and solar – at least in the period leading up to 2050.
The higher the final level of reliance on wind and solar the more important power storage becomes to manage the risk of a “supply drought” (4). The criticality of storage with increased wind and solar penetration is non linear – it increases exponentially as the proportion of wind and solar increases gets about 85%. At 92% wind and solar, Australia faces some significant challenges designing, installing and managing a power storage system that will need to both provide short term coverage and also a significant proportion of the nation’s power for a few weeks each year.
Power Imports/Exports
In addition to power storage, some nations may be able to mitigate the “supply drought” risk associated with high levels of renewables by purchasing power, especially power generated by hydro or nuclear plants, across international borders. While the majority of electricity supply and demand is located within national boundaries, about 3% of the global electricity market involves distribution across national borders. For this to occur there obviously needs to be a suitably configured distribution network allowing power generated in one country to be consumed elsewhere.
Figure 4 shows a schematic of international distribution interconnects, highlighting the fact that Europe effectively operates as a large multinational grid with power distribution routinely intersecting national boundaries. The five continental European nations listed in Table 1 above can not only trade electricity between themselves but also with the rest of Europe including major generating nations such as nuclear heavy France and Germany.
Australia and Taiwan are island nations with no international power interconnects. This will put both nations at a disadvantage relative to European and other countries which will be able to outsource some of their supply risk.
The ability to purchase power also means being able to sell power. While mitigating the impacts of a shortfall in supply due to low wind and solar radiation is critical, being able to sell excess wind and solar generation could be attractive in some situations. Relying on wind and solar for 92% of generation as may be the case for Australia will also mean regular periods of “supply excess” when generating conditions are favourable. Selling this excess across international borders is one simple mechanism to maximise capital utilisation of wind and solar assets. There have been reports of Australian energy developers exploring the potential to build interconnects from northern Australia into South East Asia for this purpose.
Figure 4 Schematic (5) showing some of the currently existing international power distribution interconnects

Summary
So what has this quick comparison told us? Firstly there is significant diversity in generating mix among mid sized nations with a grid about the same size as Australia in terms of TWhrs produced. The countries with large scale hydro and nuclear systems, typically installed decades ago, are not surprisingly much closer to decarbonisation than those, like Australia, who have relied on fossil fuels. Given opposition to nuclear and major new hydro there is likely to be two different zero carbon grid configurations – one that can rely on legacy hydro and nuclear and another made up of a high level of new wind and solar.
As nations in the second category shut down fossil generation the replacement technology will be heavily skewed toward wind and solar. This is certainly the case in Australia where the political and social appetite for nuclear or additional large scale hydro is low. One suspects there will be other countries facing the same reality. In Australia’s case it has the advantage of being almost uniquely well suited to wind and solar generation but perhaps this is a bit misleading. Lack of wind and solar resources will clearly be a major issue especially for smaller, highly populated countries but one suspects that once a threshold resource level is reached there is little further advantage to be gained in terms of domestic power supply.
A comparison with other similar sized grid shows that of the nations which will likely need over 80% wind and solar shows that Australia is in fact well placed. This is partly a reflection of the developing world status for countries like Egypt, Thailand, South Africa and Indonesia as well as the fact that Taiwan may be preoccupied with geopolitical concerns. Nonetheless Australia had 17% of its generation already coming from wind and solar in 2019, a total that increased to 20.3% in 2021. The transition to zero carbon electricity has clearly begun and with the political winds seemingly now supportive one imagines this trend will continue.
Appendix
Some other observations from the group of nations shown Figure 1 are
- There is a clear distinction between the developed nations, including Australia, with significant amounts of wind and solar generation and the developing nations which generally have far less of this form of generation.
- The three nations with the most renewables – Spain, the UK and Sweden also have the largest contribution from nuclear. Perhaps a co-incidence or perhaps an indication that zero carbon baseload power from nuclear plants helps a more aggressive roll out of wind and solar. Spain and the United Kingdom get about one third of their power from fossil fuels. Sweden is fossil fuel free
- The other fossil fuel free nation is Norway relying almost exclusively on hydropower despite being a major producer and exporter of gas
- Italy and Turkey have no nuclear capacity and get about half their power from fossil fuels
- The remaining seven nations, including Australia, get over 70% of their power from fossil fuels. All of these nations with the exception of Taiwan, produce either coal (South Africa) or natural gas gas (Egypt) or both (Australia, Indonesia, Vietnam and Thailand). It would appear that countries with established fossil fuel industries (even if relatively small) continue to use these resources for power generation.
- The use of biomass, typically wood either produced domestically or imported from heavily timbered nations such as Canada, is used in the United Kingdom, Thailand, Italy, Sweden and Indonesia. One wonders if this is a sustainable form of carbon free power or if it will be phased out over time.
- There is little evidence of widespread use of pump hydro to back up wind and solar. Perhaps this will grow in the future as the countries transition away from fossil fuels.
- https://www.eia.gov/international/data/world/electricity/electricity-generation
- Assessing vulnerabilities and limits in the transition to renewable energies: Land requirements under 100% solar energy scenarios Iñigo Capellán-Pérez, Carlos de Castro,Iñaki Artod
- Global potential for wind-generated electricity Xi Lua, Michael B. McElroy and Juha Kiviluomac
- https://journeytozerocarbon.com/?p=467
- Global Electricity Trade Network: Structures and Implications Ling Ji, Xiaoping Jia, Anthony S. F. Chiu, Ming Xu