
In 2018 the United Nations’ Intergovernmental Panel on Climate Change produced a special report on Global Warming of 1.5 degree C (1). The report, which covers a lot of ground, provides a number of theoretical global emission pathways calculated to keep warming below 1.5 degrees C. In addition to parameters such as how quickly new renewables and electric vehicles can be rolled out, the modelling shows that global primary energy consumption – the total global consumption of all forms of energy, both fossil fuel based and zero carbon – is an important variable.
Global energy demand is not a parameter that gets much airtime. Logically when all energy is carbon free the level of global consumption won’t matter from a climate perspective (though it will inevitably remain an important economic and perhaps resource availability issue). During the current transition phase, however, as global economies turn away from fossil fuels to zero emission sources, global energy demand is important. As energy demand growth in the decade from 2020 to 2030 is varied from a decrease of 15% to an increase of 39%, modelling shows that as global energy demand is minimised (or ideally reduced) fewer new zero carbon resources will be needed and the reliance on options like nuclear, carbon capture and biomass will be reduced.
In other words if less new zero carbon energy is needed we will be able to maximise the use of popular technologies like renewables with storage and have the freedom to selectively use less popular technologies like nuclear. If on the other hand global energy demand continues to increase we will have no option but to use lots of everything.
So what drives global energy demand? Population growth is the instinctive first response. All other things being equal, the more humans there are, each using energy for heating, transport, cooking food and driving demand for manufactured products, the greater global energy demand will be. Population growth alone is obviously not the full answer. The amount of energy each individual uses varies widely from rich developed countries to poor developing nations so limiting global energy demand means both reducing the energy usage of not only the current high energy consumers but also for those who aspire to the more affluent and comfortable lifestyles of the developed world. Not an easy task.
While economists would applaud a lower capital pathway to zero emissions, elected officials seem a little hesitant to promote this approach too enthusiastically. During the current debate about plans to get to net zero by 2050 (or sooner), reduced national energy demand gets relatively little coverage. Developing countries feel they need to substantially increase per capita energy usage if they are to reach living standards somewhere close to those of developed nations. Advanced economies, while keen on energy conservation and improved efficiencies, are seemingly loath to go too far down this path lest they raise concerns about local industry becoming non-competitive or limits being imposed on travel or domestic energy consumption. At a global level we are not surprisingly trying to navigate a pathway to zero carbon that avoids outcomes that the voting public would find politically unacceptable.
So what are the current global energy consumption trends? The figure below (2) shows that global primary energy consumption has grown by 20% over the past decade. Essentially all of this growth is coming from the developing (non OECD) world with a large portion coming from China (which is included in the non OECD calculation). Worryingly, Chinese energy demand shows no real sign of slowing down, with a clear increase in the last 4-5 years. This comes despite a recent commitment from China to become carbon neutral by 2060.

One small positive is that while energy demand in developed nations has not actually declined since 2009 it has at least not increased by a substantial amount. At a macro level one could conclude that developed nations have stabilised energy demand without a major sacrifice in living standards or too much political disquiet. A deeper dive – beyond the scope of this discussion – might find that while the GDP in developed nations has continued to grow and professional classes have continued to live comfortable, well remunerated lives there are groups for whom this is not the case. From a climate perspective, however, the fact that China and the rest of the developing world continues to require more energy represents a bigger challenge – can they decarbonise while continuing to strive for the benefits and high energy needs of those in the developed world?
The figure below (2) helps quantify this dilemma. The energy demand in OECD countries, essentially constant at about 180 GJ/person, is roughly two and half times greater than the global average. The higher standard of living enjoyed by those living in developed economies is clearly energy intensive – a fact not lost on those living in developing nations.
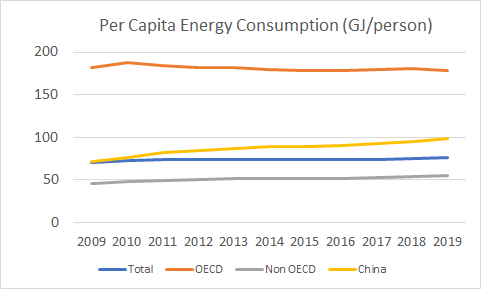
Another point evident from the graphs above is that China is increasingly differentiating itself from other non OECD nations. Its per capita energy consumption has risen from 75 GJ/person to about 100 GJ/person over the last decade – a much faster rate than the overall non OECD grouping which remains pretty stable at 50 GJ/person. To achieve a clearer picture of the global energy challenge one really needs to separate China from the other non OECD nations.
Splitting out a “non OECD less China” grouping is part of the next analysis – an examination of what role population growth is playing in increased global energy demand as shown in the table below.
| Total | OECD | Non OECD | China | Non OECD ex China | |
| Growth in Energy Consumption (%) | 20.9 | 3.9 | 35.8 | 45.3 | 30.0 |
| Population growth (%) | 12.1 | 6.1 | 13.7 | 5.3 | 16.4 |
| Contribution of population to increased Energy usage. to population | 58% | 157% | 38% | 12% | 55% |
On a global basis just over half (58%) of the increase in global energy consumption over the past decade is correlated with population growth, suggesting that just under half is the result of increased individual consumption. A similar split is observed for non OECD less China. This is the largest group by population (over 6 billion compared with around 1.3 billion for both China and the OECD nations) so it is perhaps not a surprise that it has an energy consumption profile similar to the globe as a whole. Of concern for climate advocates is that this group has the fastest population growth – three times higher than China and the OECD – which on its own drives significant growth in energy demand. In addition demand growth is also coming from increased per capita consumption in countries like India, Indonesia, Vietnam and across the middle east. The UNIPCC modelling suggests that this will make global decarbonisation incrementally more difficult.
Trends within the OECD grouping are, in contrast, mildly positive. As shown in the table above population growth accounts for 157% of the observed increased energy usage, meaning that individual consumption has been decreasing – driven in part, one imagines, by an increased investment in renewables for power generation and a greater political acceptance of decarbonisation policies. It is worth noting that this downward trend can be seen right across the OECD, including countries like Australia, the US and Canada which have per capita emissions well above the OECD average.
A key question will be whether developed countries can continue to drive down per capita energy consumption without getting political push back and in so doing provide a lower energy target for aspiring nations.
At the other end of the scale, the energy demand growth in China encapsulates the challenge associated with developing countries emulating wealthier economies. Chinese energy consumption is growing at a higher rate than the other two major national groupings with close to 90% of this growth resulting from the higher individual consumption associated with a higher standard of living. The last decade has seen the average Chinese citizen close the energy gap with their western counterparts – they still, however, have a long way to go to fully close the gap and there are 6 billion others in the developing world that will potentially follow the same trajectory.
So what does this all mean? If one concludes that reducing global energy demand over the next decade is unlikely to happen then what are the implications according to the UNIPCC modelling? A quick summary looks like this
- Significant levels of oil and gas still being used in 2050 to meet overall global energy demand
- A surge in the use of nuclear power post 2030, with this form of generation growing by 500% relative to current levels
- A much greater need to rely on Carbon Dioxide Removal technologies – some of which are still in the development stage. These include massive levels of forest regrowth, direct air capture and storage, power generation via specifically harvested bio energy crops, widespread use of carbon capture and storage and a strong focus on improved soil management to increase the amount of carbon stored as organic matter.
There will of course be other modelling which promotes different pathways and conclusions and, in theory, there is still time to see a downturn in global energy demand. What does seem clear is that if China and the rest of the developing world continues to demand greater access to cheap energy it will be hard to satisfy this demand without keeping some of the current fossil fuel sources on line past 2050 and in all probability requiring new fossil fuel facilities to be constructed. It also seems pretty certain that unpopular technologies like nuclear and carbon capture and storage will be needed along with a much greater emphasis on programs that will restrict and regulate land use practices. It is no wonder that even with virtually all nations committing to net zero some time this century achieving this goal remains a very difficult task
- https://www.bp.com/content/dam/bp/business-sites/en/global/corporate/pdfs/energy-economics/statistical-review/bp-stats-review-2020-primary-energy.pdf